Key takeaways
- Contour lines join points of equal height. Their spacing tells you how steep the ground is; their shape tells you where water goes.
- Slope in percent is the height difference divided by the horizontal distance, times 100. Use the calculator below.
- Free national DEMs such as CartoDEM and SRTM are about 30 m resolution: good for screening a site, not for design. Get a ground survey before you plan levels.
- Look for where water collects: low corners, flow lines crossing the plot, and land below a lake, tank or drain.
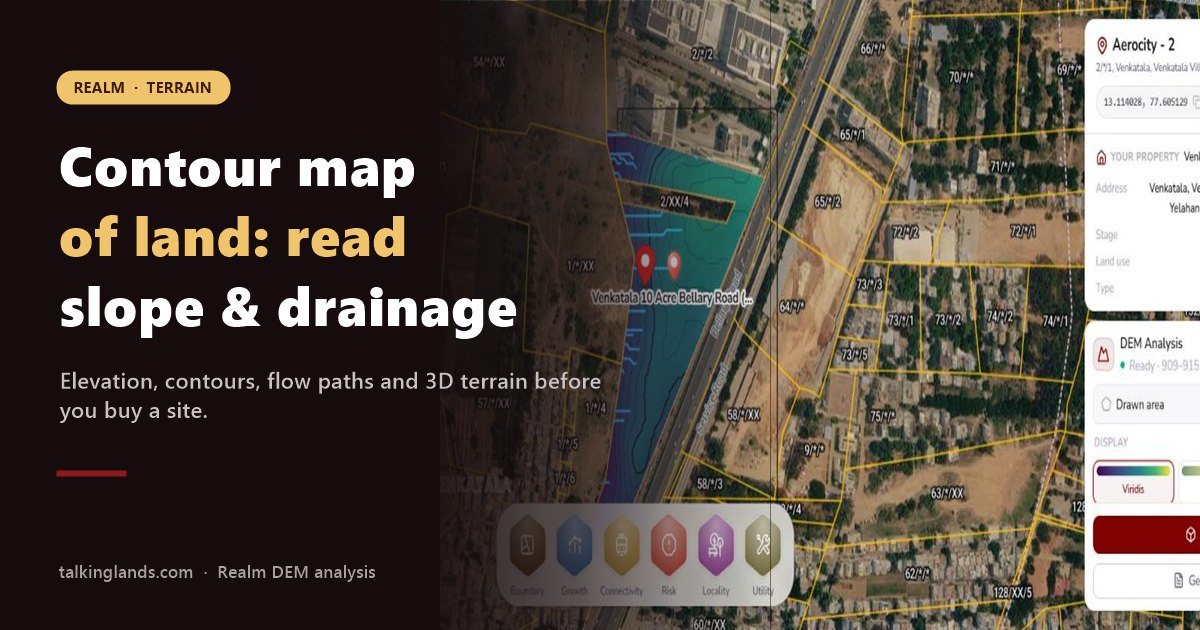
- On a real 10.26-acre Bengaluru site, Realm's DEM tool showed 909 to 915 m, a mean slope of 1.8°, a maximum of 4.9° and a west-facing fall: flat, easy to build on, with drainage running to the west edge.
How steep is this plot?
Enter the height difference and the horizontal distance between two points. Nothing you type is sent anywhere.
Two plots on the same road, same price, same zoning. After the first heavy monsoon, one is dry and the other holds water for a week, because it sits a metre lower and the neighbour's land drains into it. A contour map would have shown that in a minute. This guide explains how to read one, how to work out slope and drainage, and what a real site looks like when you run the analysis.
What a contour map is
A contour map draws the height of the ground with lines. Each contour line joins points at the same height above mean sea level. The contour interval is the height difference between two neighbouring lines, for example 0.5 m on a site plan or 20 m on a regional topographic sheet. Every fifth line is often drawn thicker and labelled, called an index contour.
How to read contour lines
| What you see | What it means on the ground | What to check on a plot |
|---|---|---|
| Lines far apart | Gentle or flat ground | Drainage: very flat land can hold water |
| Lines close together | Steep ground | Cut and fill, retaining walls, road gradients |
| Evenly spaced lines | A uniform slope | Usually the easiest to plan roads and plots on |
| V shapes pointing uphill | A valley, stream or natural drain | Is it a recorded nala or drain with a buffer? |
| V or U shapes pointing downhill | A ridge or spur | Good building spots, but check access |
| Closed loops rising inward | A hill or mound | Rock, earthwork cost |
| Closed loops falling inward | A depression or low spot | Water will collect here; plan storm water first |
Contour map, topo map or DEM?
- Topographic (topo) map: a general map showing relief with contours, plus roads, rivers, settlements and land cover. Survey of India toposheets are the classic example.
- Contour map: just the height lines, often drawn for a specific site from a survey.
- Digital elevation model (DEM): a grid of height values. Contours are one way to draw it; the same DEM also gives slope, aspect (which way the land faces), relief, flow paths and a 3D view.
Slope and drainage: the two things that cost money
Slope drives earthwork. Slope in percent is rise divided by run, times 100: a 2 m rise over 100 m is 2%, about 1.1°. The steeper and more uneven the plot, the more you spend cutting, filling and building retaining walls, and the harder it is to lay roads at comfortable gradients.
Drainage drives risk. Water follows the steepest way down, so flow paths drawn from a DEM show where storm water will run across your land, and where it will pool. In Bengaluru, natural drains are often recorded as rajakaluves with buffer zones, which our guide to rajakaluve buffer zones explains.
A real 10-acre example in Realm
We ran Realm's DEM analysis on a 10.26-acre site on Bellary Road in north Bengaluru, during the same walkthrough we used for our title search guide. Click the plot, and Realm draws the elevation, contours and flow paths over satellite imagery.
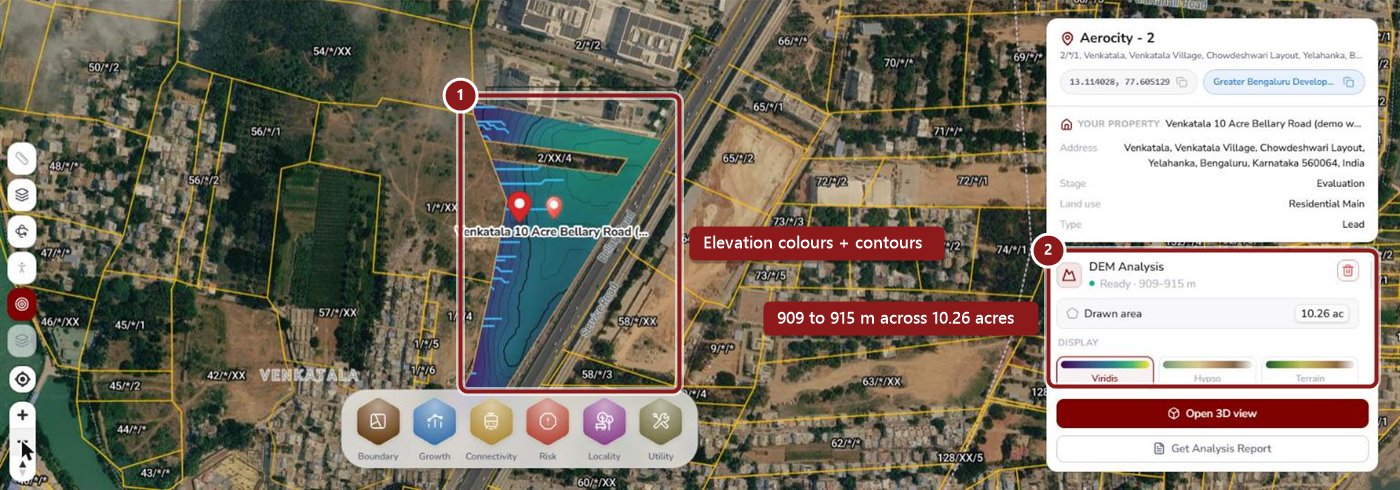
- 1Elevation colours from low (purple) to high (green), with contour lines at 0.5 m and 2.5 m.
- 2The result panel: ready, 909 to 915 m above sea level, across 10.26 acres.
Realm classifies this plot as flat. That is good news for layout and road costs. The more important question is where the water goes.
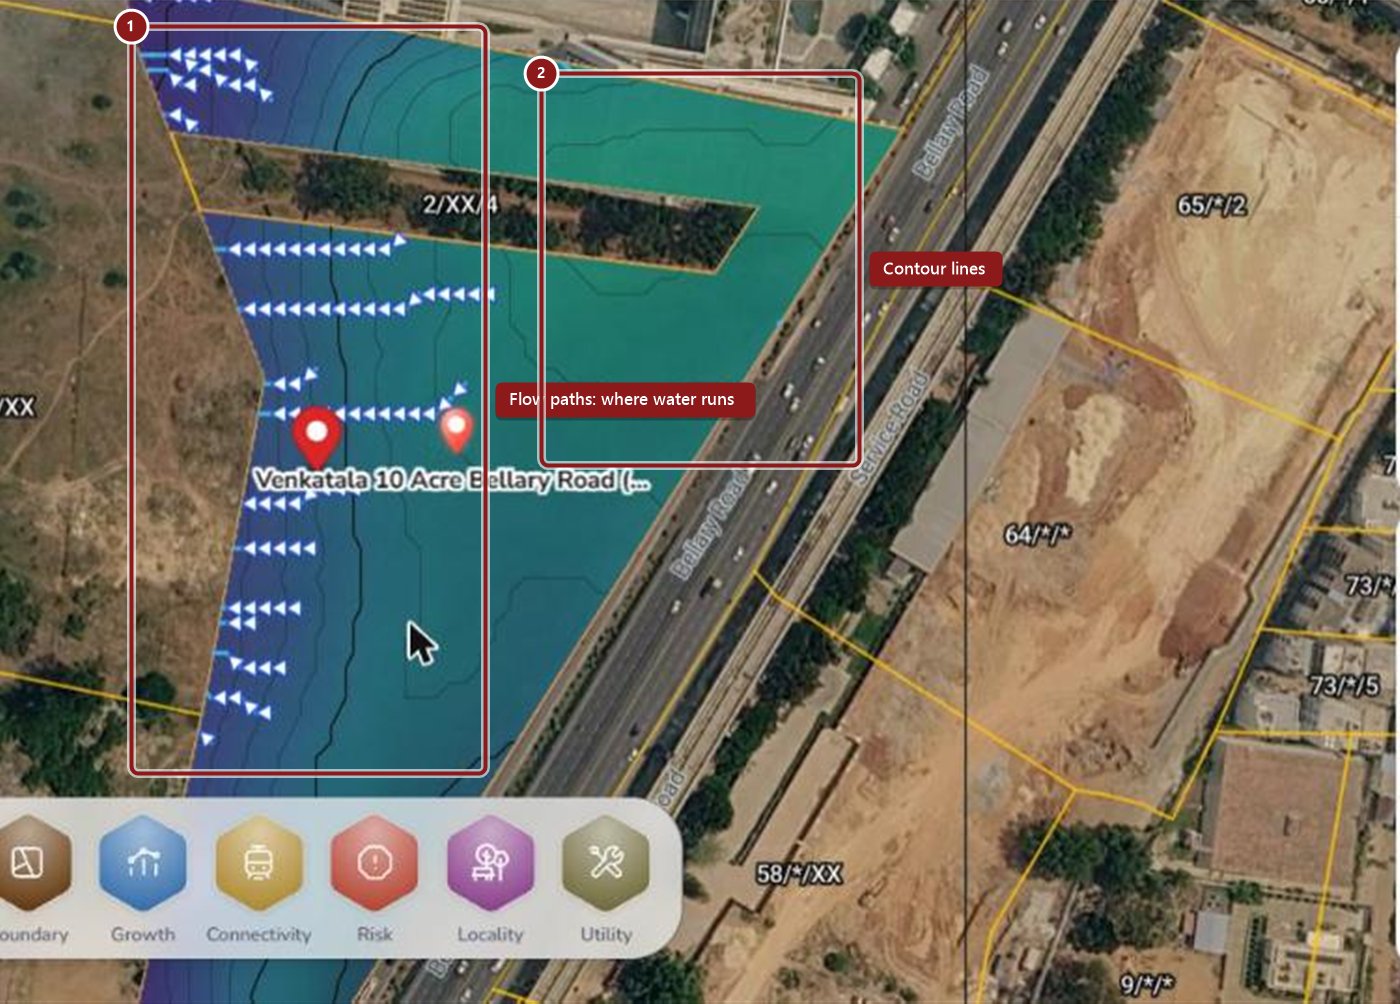
- 1Flow paths run west, to the plot's western boundary. That edge is where storm water drains, rainwater harvesting and any detention pond belong, and where you must check what the neighbouring land does with the water.
- 2Contour lines are widely spaced across the plot, which is why it reads as flat.
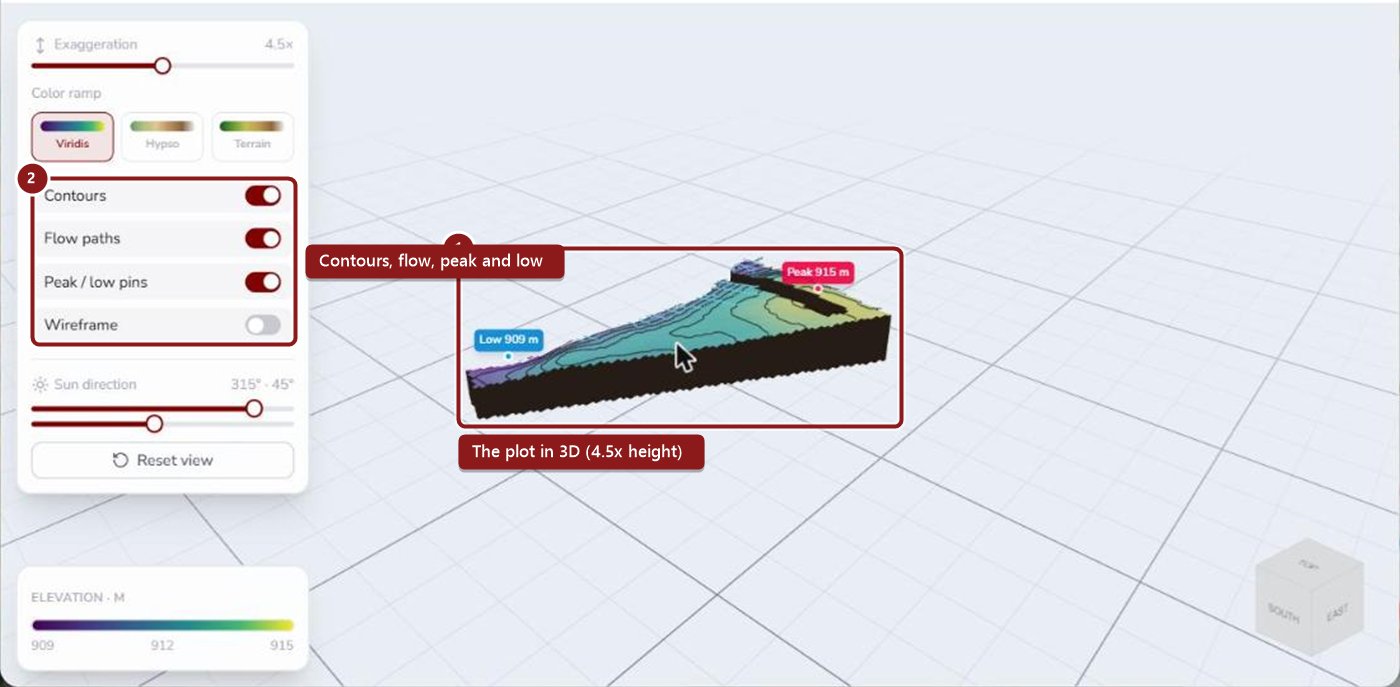
- 1The plot in 3D, with the low point (909 m) at the west and the peak (915 m) at the north-east corner.
- 2Toggle contours, flow paths and peak and low pins, and change the colour ramp and vertical exaggeration.
Realm also produces an analysis report from the same screen, so the terrain findings sit with the land lead alongside the legal, zoning and FSI and buildable area checks.
Where to get contour data in India
- Survey of India toposheets: official topographic maps with contours, useful for the regional picture.
- CartoDEM on Bhuvan: ISRO's DEM from Cartosat-1 stereo data, about 30 m resolution, free to download.
- SRTM on USGS EarthExplorer: a global DEM at about 30 m resolution, also free.
- A ground survey: total station, DGPS or drone survey of the actual plot, for design levels.
- Realm DEM analysis: click a plot to get elevation, contours, slope, aspect, flow paths and a 3D view in one place.
Mistakes to avoid
For the full pre-purchase checklist, see our land due diligence checklist and our guide to land mapping software.
See the terrain before you buy the land
Realm runs a DEM analysis on any plot: elevation, contours, slope, aspect, flow paths and a 3D model, next to the land records and zoning.
Book a Realm demoFrequently asked questions
It is a map that shows the height and shape of the ground using contour lines, each joining points of the same height above mean sea level. The spacing of the lines shows how steep the land is, and their pattern shows ridges, valleys and low spots.
Read the contour interval first, the height difference between two lines. Lines close together mean steep ground, lines far apart mean gentle ground. V shapes pointing uphill mark valleys and streams; V or U shapes pointing downhill mark ridges. Closed loops mark a hill, or a depression where water collects.
A digital elevation model (DEM) is a grid of height values. A contour map is one way of drawing that data as lines. From the same DEM you can also calculate slope, aspect, relief, flow paths and a 3D view.
Divide the height difference by the horizontal distance and multiply by 100 to get the slope in percent. A 2 m rise over 100 m is a 2% slope, about 1.1 degrees.
Survey of India topographic sheets, the CartoDEM from ISRO's Bhuvan portal and the SRTM DEM from USGS EarthExplorer are free sources at around 30 m resolution, good for screening. For design and levels, commission a ground survey with a total station, DGPS or drone. Realm by TalkingLands runs a DEM analysis on any plot with contours, slope, flow paths and a 3D view.
Not always. Very flat land can drain poorly and hold water after heavy rain, so it needs careful storm water design. A gentle, even slope is usually the easiest to build on. Steeper land costs more in cutting, filling and retaining walls.
This article is general information. Slope bands are a rule of thumb, not a building standard; site design must follow a ground survey, your engineer's advice and local regulations. The DEM results shown come from Realm on a TalkingLands demo account in November 2026.